Measuring Student Progress in Bangladesh: Beyond Exam Results
At Evidence Based Teacher Development (EBTD), we believe great education isn’t defined by who achieves the highest grades, but by how far every student travels.
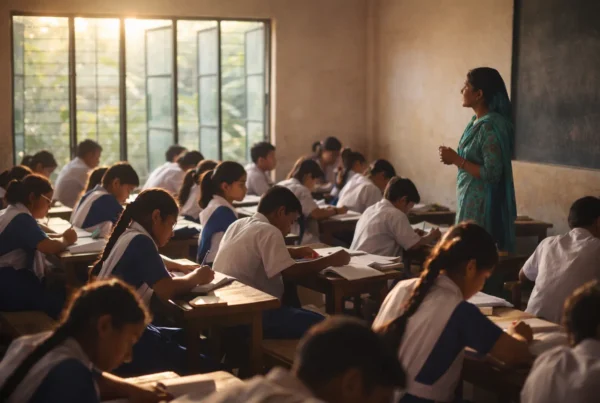
Across Bangladesh, school performance is still judged almost entirely by final exam results — SSC and HSC pass rates, O-Level grades, and university placements. But these scores, while important, don’t tell the full story of learning.
International bodies like UNESCO have long highlighted the need for countries to track learning progress, not just outcomes. As early as 2015, UNESCO urged governments to create at least one reliable national measure of student learning — especially in lower-income countries — to see whether reforms are genuinely improving education.
For Bangladesh, this message remains timely. With classrooms full, attention must now shift from access to progress.
Why final exam scores can mislead
Imagine two schools.
School A selects only the top 5 % of students. Most of them arrive already fluent in English and confident in algebra. Unsurprisingly, nearly everyone secures A*s in O-Levels.
School B, by contrast, admits a wide mix of learners — some entering below grade level, others with strong potential but limited support. By Year 11, many achieve C or D grades.
If we look only at final results, School A appears stronger than School B. Yet that conclusion ignores where each student started.
A fairer question would be: how much progress did each student make?
This is the principle behind value-added measurement — assessing how much learning a school enables, not just how many top grades it produces. International research shows that roughly half of a student’s final exam performance can be explained by their starting ability. Comparing final results alone therefore tells us more about intake than about the learning that occurred.
Why progress measures matter
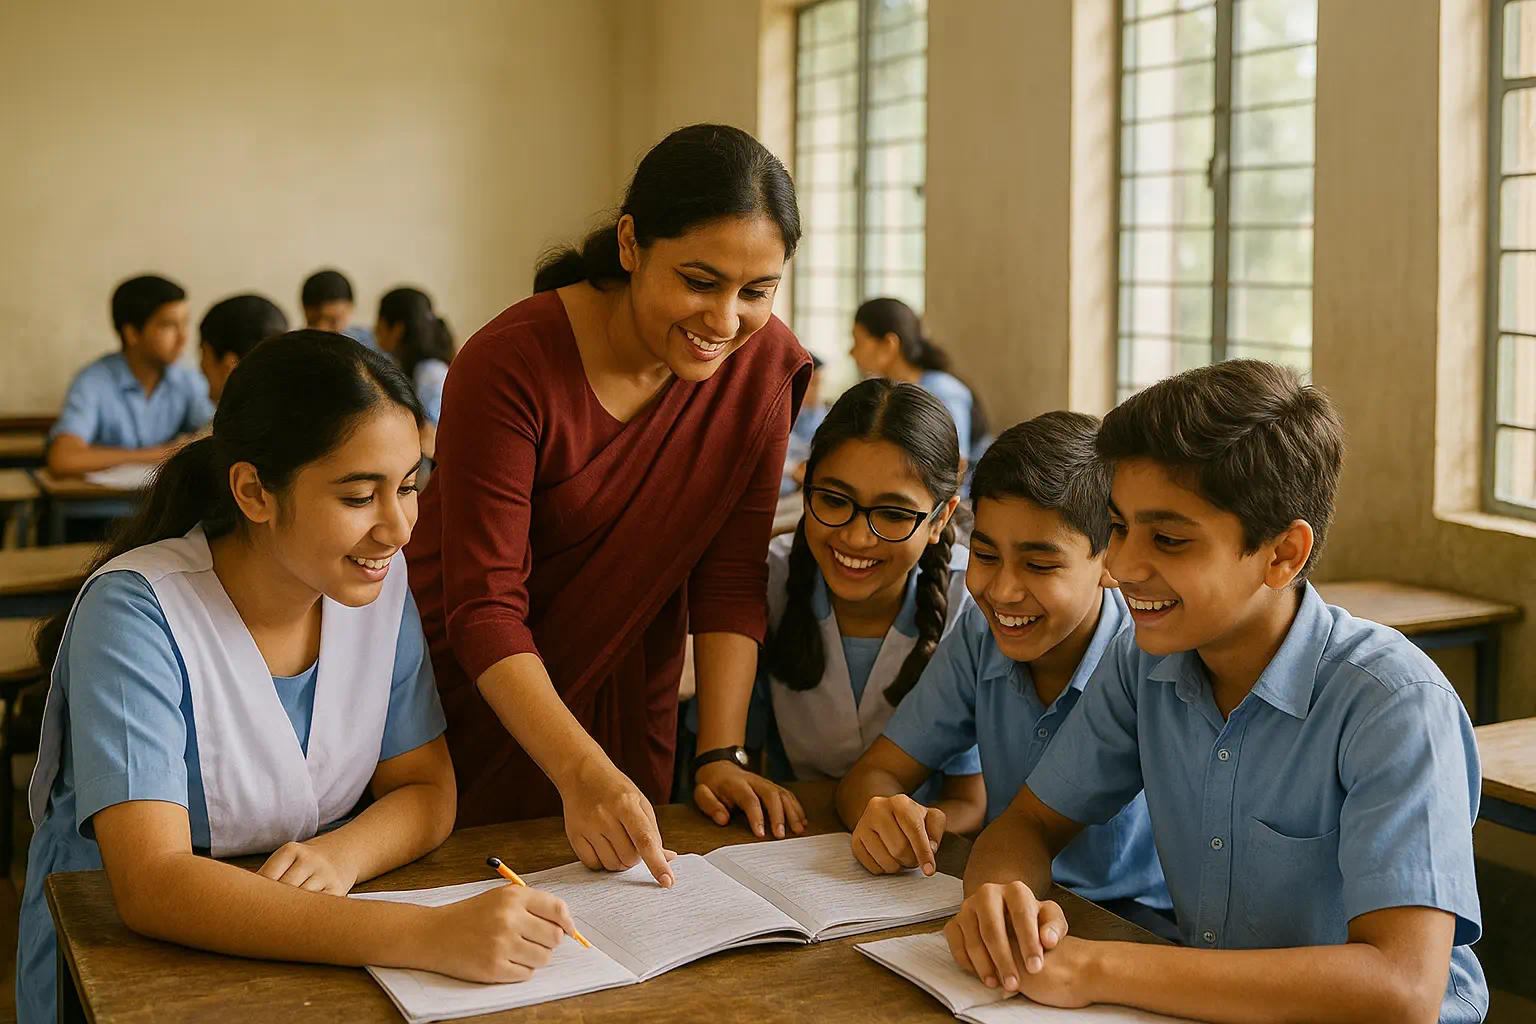
Given what we know about each student’s starting point, how much growth did they make — and what helped that growth happen?
It’s a more constructive way to understand learning and teaching quality.
Systems such as Progress 8 in England and similar frameworks in the US use this principle to help schools understand their impact and plan improvement. Rather than rewarding only high attainment, they recognise the teachers and schools that move learning forward, regardless of where students begin.
For Bangladesh, where school intakes vary widely and high-stakes exams still dominate, adopting such an approach would transform how success is understood — shifting the focus from comparison to continuous improvement.
Building a Progress System: Using Baseline Assessments as an Example
One practical way to measure student progress is to use standardised baseline assessments at key transition points in schooling. These assessments – offered by several international providers – measure core learning skills such as vocabulary, mathematics, reasoning, and problem-solving. Their purpose is not to judge, but to help teachers understand each student’s starting point so that learning growth can be tracked fairly over time.
To illustrate how this can work in practice, let’s take the example of Cambridge’s MidYIS and Yellis systems.
MidYIS (Middle Years Information System) is typically taken early in secondary school (Class 7 or Year 7).
Yellis is often used around Class 10 (Year 10), just before students begin their O-Levels or IGCSEs.
Together, these tests provide a baseline for predicting later performance and help teachers plan targeted support. Cambridge’s studies show a moderate link between baseline scores and later exam results (correlations of around 0.55 in the UK and 0.53 internationally). This suggests that such assessments – whether from Cambridge, GL Assessment, NFER, or other reputable providers – can provide a statistically reliable foundation for understanding progress.
Independence note: EBTD has no commercial link with any assessment provider. We reference MidYIS and Yellis simply as an illustration of how a school might use a standardised baseline test to inform improvement planning. Other established tools can serve the same purpose; schools should choose whichever aligns best with their curriculum, resources, and philosophy.
Establish a clear baseline, track progress against it, and use that evidence to strengthen teaching, learning, and professional development.
What it could look like in a school
Step 1: Baseline testing
At the start of Class 7, every student sits a baseline test measuring literacy, maths, and reasoning. The results produce a standardised score — showing how each student compares to a large international sample.
For example, imagine a Class 7 cohort of 100 students with scores between 85 and 120.
| Baseline Score | Expected O-Level Grade | What That Means in Practice |
|---|---|---|
| 90 | ≈ Grade 4 (C) | Students starting below average; strong teaching should still lift them to secure pass levels. |
| 100 | ≈ Grade 5 (B–C) | Average ability; expected to meet O-Level benchmarks with consistent progress. |
| 110 | ≈ Grade 6 (B) | Above-average entry; opportunities for deeper thinking and extension tasks. |
| 120 | ≈ Grade 7 (A) | High baseline; aim for stretch and enrichment, and possible peer mentoring roles. |
Each student’s predicted grade acts as a reference point, not a limit.
When schools collect this data, they can:
- See how their cohort compares with international norms.
- Identify areas where baseline skills are weaker (for instance, reasoning or vocabulary).
- Plan interventions and staffing more strategically from the very start of the year.
Step 2: Monitoring progress
By Class 10, the school re-tests using Yellis (or another comparable measure). This shows whether students have made expected progress from their original baseline. If the cohort average falls below expectations, leaders can explore factors such as teaching methods, curriculum balance, or resource allocation.
Step 3: Reviewing value added
When O-Level results arrive, the school compares predicted grades (based on baseline data) with actual grades to calculate value added.
Example:
- Student A had a predicted grade 5 but achieved grade 7 → strong progress.
- Student B predicted grade 6 but achieved grade 5 → progress below expectations.
Averaged across the cohort, this gives a clear picture of where learning is accelerating and where extra support is needed.
- Departments with strong progress can share effective strategies.
- Areas with lower progress can receive additional coaching, mentoring or professional development.
This process turns assessment into a learning conversation — not about ranking or inspection, but about reflection and growth.
Cost and practicality
Affordability matters.
International baseline assessments are subscription-based, with per-student fees that decrease for larger cohorts. For example, Cambridge’s published 2023–24 pricing lists a one-time product fee of $180, plus per-student fees starting at $12.60 (≈ BDT 1,530) for small cohorts, falling to $6.60 (≈ BDT 800) for larger ones.
For roughly the cost of a single textbook per student, a school gains reliable data to guide teaching and demonstrate progress to parents and boards.
Why this investment matters
Bangladesh has achieved near-universal enrolment, but the next challenge is ensuring that every student continues to learn and improve. Progress measures:
- Support effective teaching – helping schools identify where learning growth is strongest and share good practice.
- Promote equity – highlighting where students from different backgrounds need additional support.
- Strengthen reflection – providing school leaders with evidence to inform improvement planning.
- Empower professional growth – turning progress data into purposeful professional development.
Ultimately, they shift the conversation from “Who got the highest mark?” to “Who made the most progress?” — a far more constructive question for long-term improvement.
Communicating progress to parents
Parents are accustomed to final grades, not progress charts. Schools introducing baseline measures should explain results simply:
“Your child started here, and over three years made this much progress — more than, equal to, or below what we would expect.”
A student who moves from a predicted C to an actual B has exceeded expectations; a student who falls short may need targeted support.
This clarity builds trust and helps families see education as a journey of growth, not a one-off event.
A step towards fairer evaluation
Progress measures are not a replacement for final exams — they are a complement that brings balance, fairness and depth. They encourage collaboration, early intervention and reflective leadership — exactly the culture Bangladesh’s schools need for sustained improvement.
At EBTD, we see enormous potential for this approach. By embedding standardised baseline assessments such as MidYIS, Yellis, or other equivalent tools, schools can move beyond the narrow lens of pass rates and start to capture what truly matters: how much every learner grows.